


Local districts frustrated with report card
DAVE MOSIER/independent editor
What’s clear about the 2015-16 State Report Cards is that none of Van Wert County school districts is likely pleased with its results, while all are getting more and more frustrated with an assessment process that changes each year.
The common thread running through all the comments from educators, as well as the Ohio School Boards Association, is the difficulty teachers and administrators have of hitting what they all “a moving target.”
Overall, we were satisfied in some areas with our results on the State of Ohio Report Card; however, for some areas we were not,” said Lincolnview Superintendent Jeff Snyder, noting that there are now 30 indicators that educators have to deal with in the current assessment. “As one reviews the past history of the report card, it continues to be a moving target, with more measures, indicators, and components.”
Snyder also expressed his displeasure with the ever-changing process, noting that, for some test areas, it was the third different test in three years.
“It has been very frustrating for our staff to analyze proper data, deal with a constant change on how the tests are being delivered (online testing), and to get the proper amount of feedback from the test results back in a timely manner so our staff can make the necessary changes to improve the growth of our students,” Snyder said, while adding, “The Lincolnview faculty and staff are outstanding and we could not be prouder of their efforts and commitment to the students of our fine school.”
Van Wert Superintendent Ken Amstutz agreed with Snyder on the frustrations of the report card process.
The Van Wert superintendent said the tests are particularly hard on classroom teachers, who try hard to do the best job they can every day and are left feeling “what do we do now” when the latest report card results are released.
“Our people are working very hard; they’re working harder than they probably ever have, I think we’re teaching kids better than we ever have,” Amstutz said, “but the moving target just crushes us, because the expectations, a lot of time we don’t know what the expectations are.”
“The problem, as I see it, there are far too many indicators to begin with (three times the number the assessment program started with),” Amstutz said, while adding, “None of us are afraid of accountability, but, on the flip side, let’s play fair.”
Like Amstutz and Snyder, Crestview Superintendent Mike Estes praised his staff, while criticizing the ever-changing goals of the report cards.
“Regardless of the scores on this report card, I believe that the students in our district are receiving an excellent education from a staff that is committed to this mission,” Estes noted, adding, “We will continue to look to improve, but it is difficult to hit targets that are continually changing.”
Ohio School Boards Association President Eric Germann, who is also a Lincolnview school board member, said he also felt the state report card needs to be more “holistic” approach to assessing a student and district achievement, adding that other factors, including job, college, and military placement, scholarships awarded, the arts, and community service should be part of the “overall picture of student success”.
The OSBA, as a group, expressed concerns that 2016 is the third year in a row with different tests and varying standards, noting that school districts need adequate time to properly prepare for such transitions.
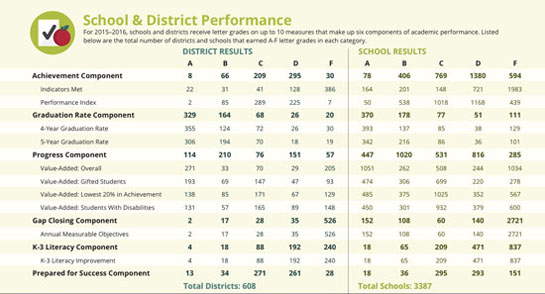
This year’s report cards include six assessment components: Achievement, Gap Closing, Progress, K-3 Literacy, Graduation Rates, and Prepared for Success.
Two of the three schools, Crestview and Lincolnview, earned Cs on Achievement, while Van Wert earned a D. Crestview met the largest percentage of indicators (58.6 percent), while Lincolnview met 48.3 percent, and Van Wert 31 percent.
All three school received Fs on the “Gap Closing” portion of the report card, but that’s not surprising: 526 of Ohio’s 608 school districts flunked that portion of the report card, with just two districts earning an A in the category.
The K-3 Literacy component was another area where districts were hard-pressed to excel. Crestview earned a C, while Van Wert earned an F on the component. Lincolnview earned a bye on the component because it did reportedly not have enough K-3 students to provide a satisfactory testing sample, according to the ODE.
Statewide, just four districts earned an “A” on the K-3 Literacy component, with 432 districts either receiving a “D” or an “F” on the component.
All three districts did well on the Progress component, with Van Wert and Lincolnview earning “A”s, while Crestview had a B. All three earned As for graduation rates all above 95 percent, while all earned a “C” on the Prepared for Success component. Those results were typical, since just 13 districts earned an “A” in the component, while 532 of the 608 districts received either a “C” or a “D”.
Despite the ever-changing bar the state report cards represent, local superintendents were upbeat about their ability to eventually return to the kinds of results all three received before the state report cards went to giving letter grades three years ago.
“We’ll figure it out eventually,” Amstutz said, noting that the district will again review the results and work on a plan to improve on next year’s report card.
“We have always been up to the task to get better in all areas and we have been currently focusing on providing high quality and highly effective instruction in our classrooms,” Snyder added.
POSTED: 09/16/16 at 8:03 am. FILED UNDER: News